Equirectangular and Mercator projection viewer using lighting combined with texture mapping written in Vanilla Javascript and WebGL.
Around the World in 481 Historical Figures.
For educational purposes only.
This is a demo for teaching CG, which became overly complicated, and it is similar to Lighting2, except we define a 3x3 matrix for material properties and a 3x3 matrix for light properties that are passed to the fragment shader as uniforms. Edit the light and material matrices in the global variables to experiment or startForReal to choose a model and select face or vertex normals. Three.js only uses face normals for polyhedra, indeed.
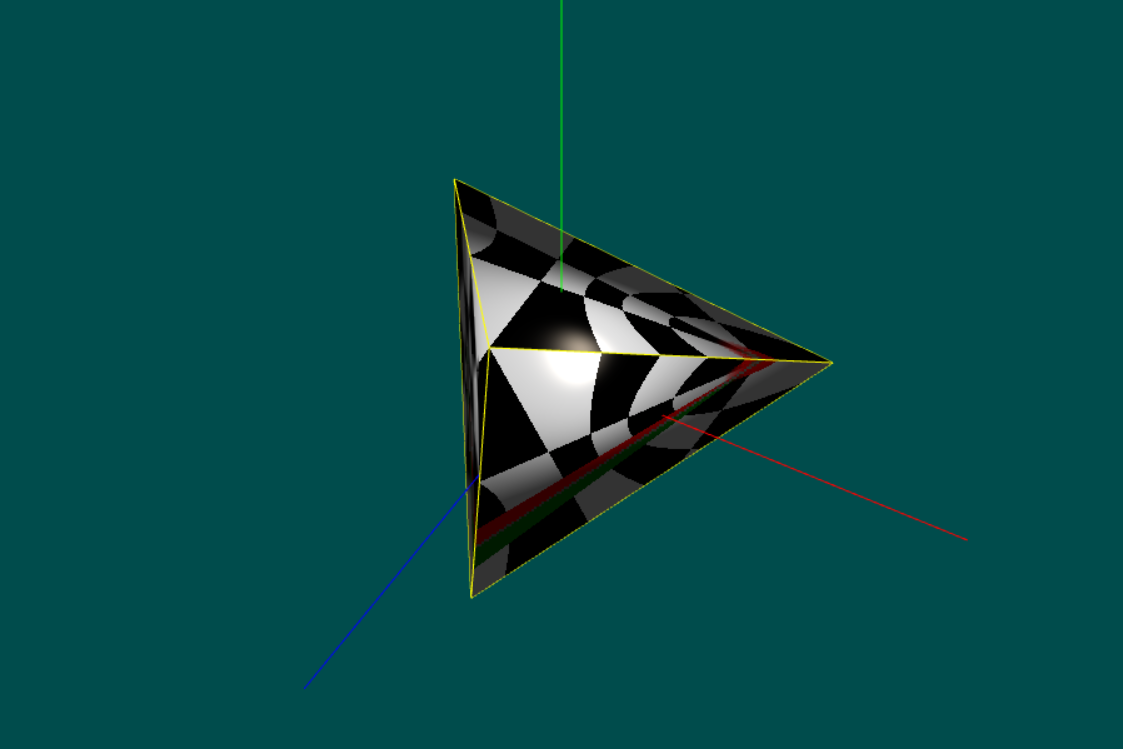
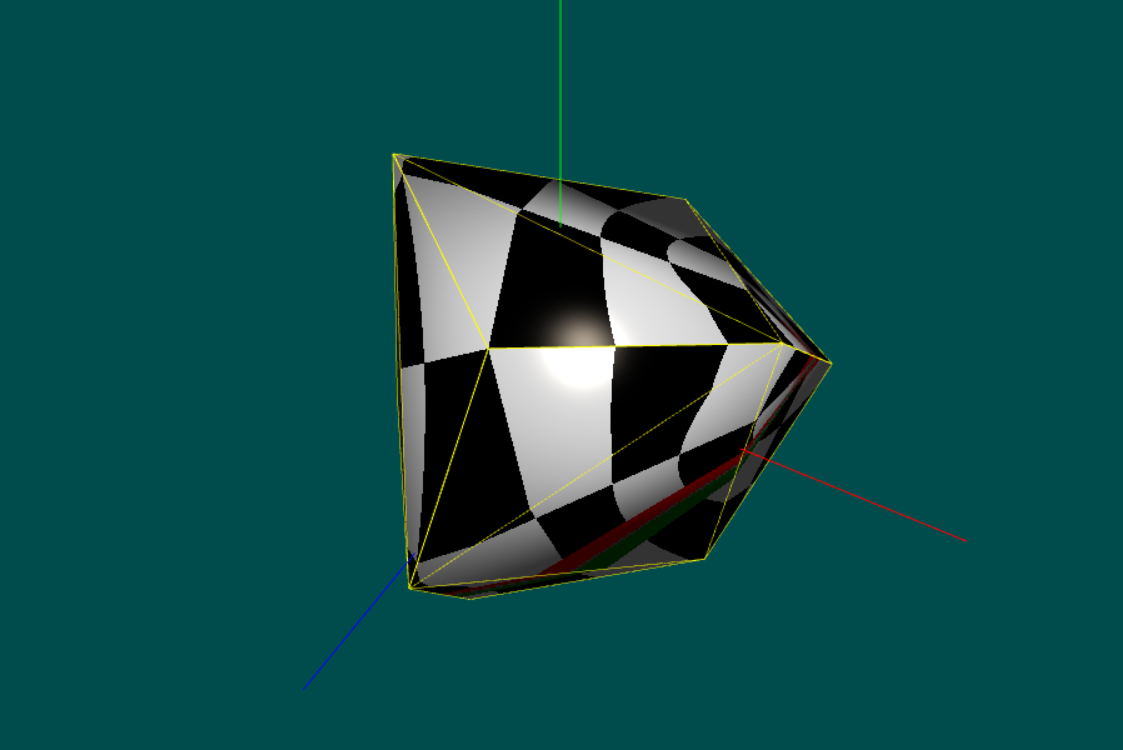
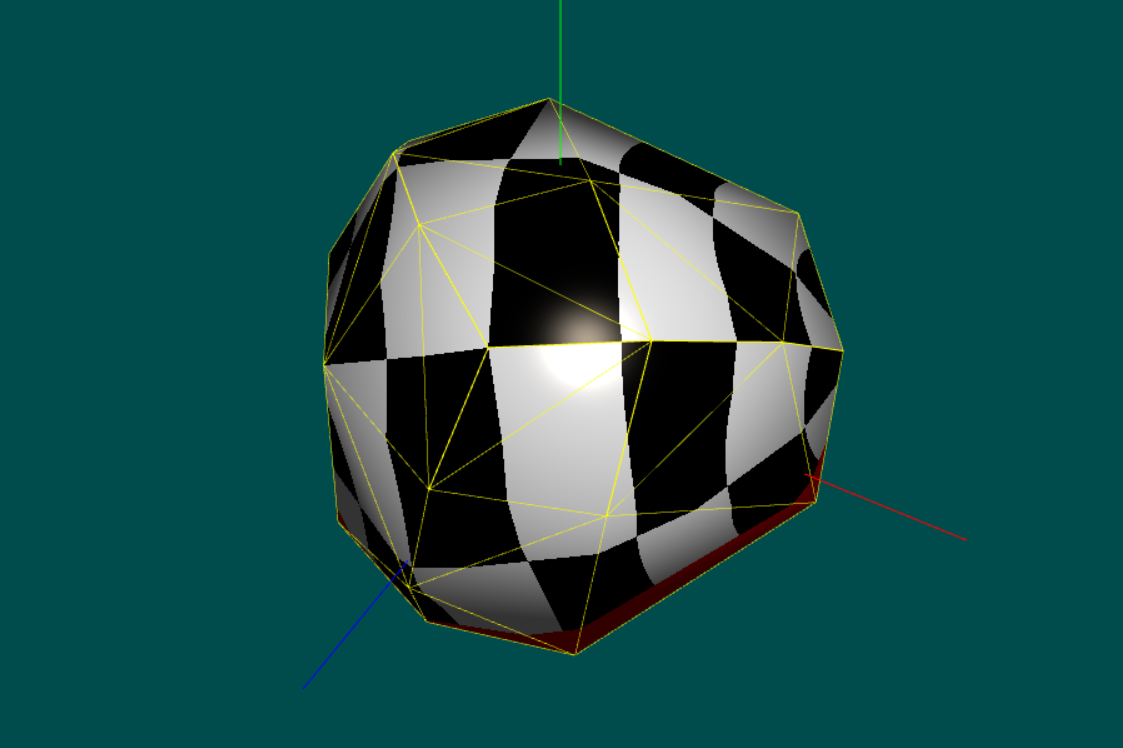
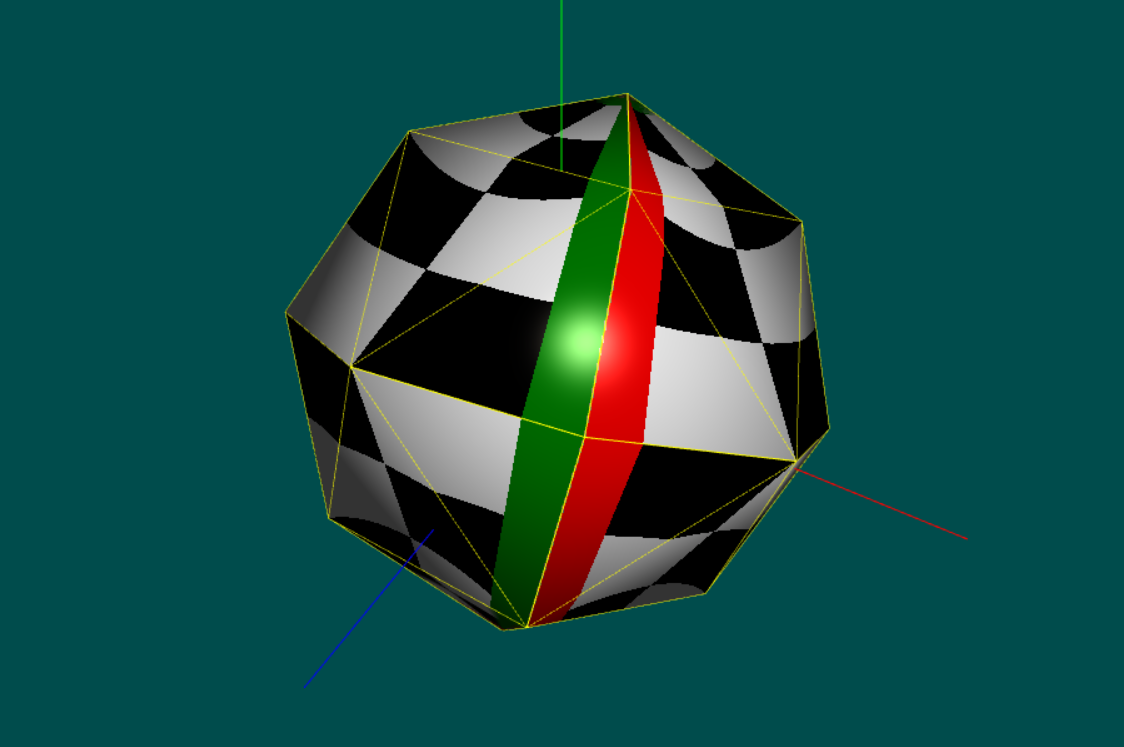
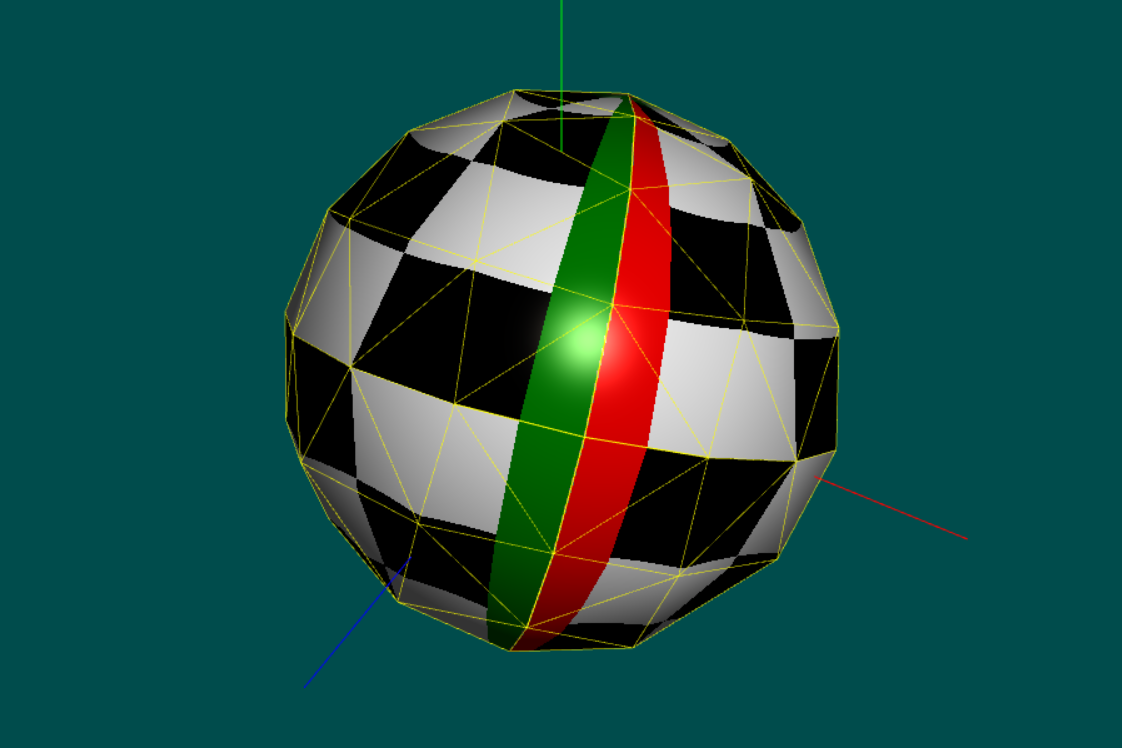
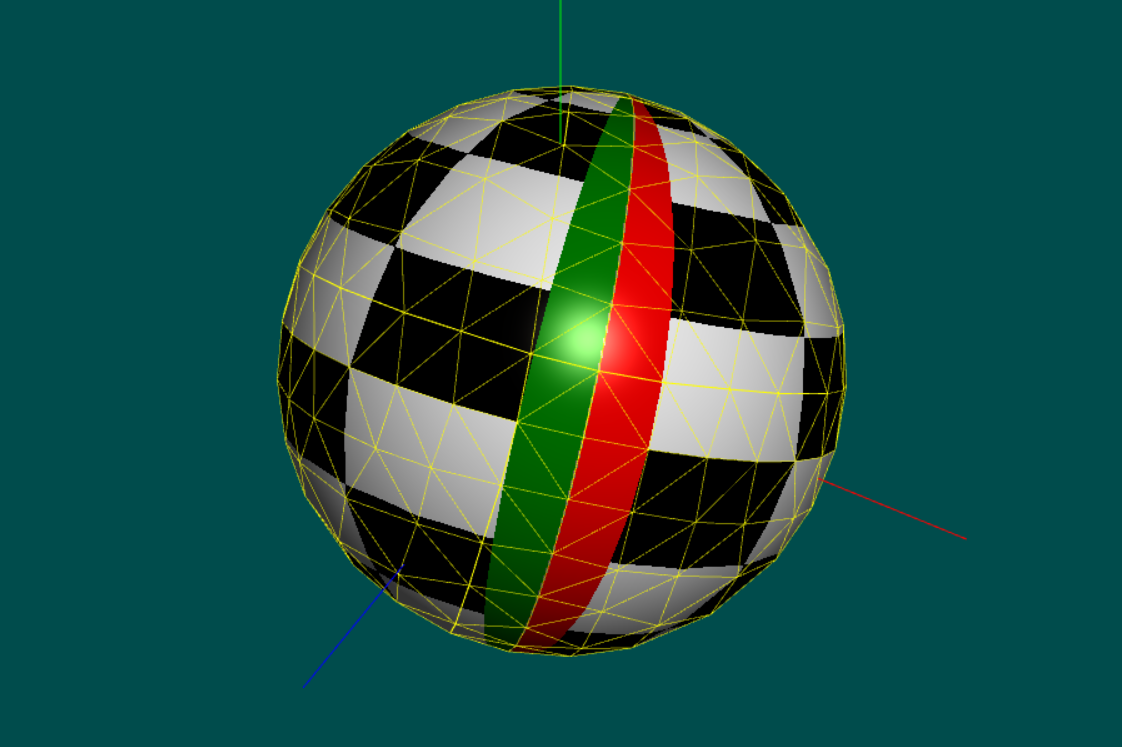
Texture coordinates can be set in each model or sampled at each pixel in the fragment shader. We can also approximate a sphere by subdividing a convex regular polyhedron and solving Mipmapping artifact issues by using Tarini's method, in this case. These artifacts show up due to the discontinuity in the seam when crossing the line with 0 radians on one side and 2π on the other. Some triangles may have edges that cross this line, causing the wrong mipmap level 0 to be chosen.
To lay a map onto a sphere, textures should have an aspect ratio of 2:1 for equirectangular projections or 1:1 (squared) for Mercator projections. Finding high-resolution, good-quality, and free cartographic maps is really difficult.
The initial position on the screen takes into account the obliquity of the earth (23.44°), and the Phong highlight projects onto the equator line if the user has not interacted using the Arcball. If PHP is running on the HTTP server, then any image file in directory textures will be available in the menu. Otherwise, sorry GitHub pages, only the images listed in the HTML file.
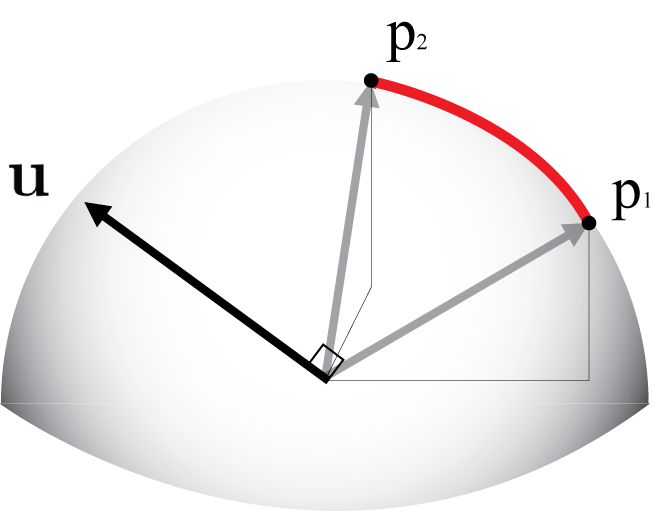
Maps are transformations from 3D space to 2D space, and they can preserve areas (equal-area maps) or angles (conformal maps). In terms of projection invariance, loxodromes appear as straight lines on conformal map projections. Therefore, the success of the Mercator projection lies in its ability to preserve angles, making it ideal for navigation (directions on the map match the directions on the compass). However, it distorts areas, especially near the poles, where landmasses appear much larger than they are in reality. Meridian and parallel scales are the same, meaning that distances along a parallel or meridian (in fact, in all directions) are equally stretched by a factor of sec(φ) = 1/cos(φ), where φ ∈ [-85.051129°, 85.051129°] is its latitude.
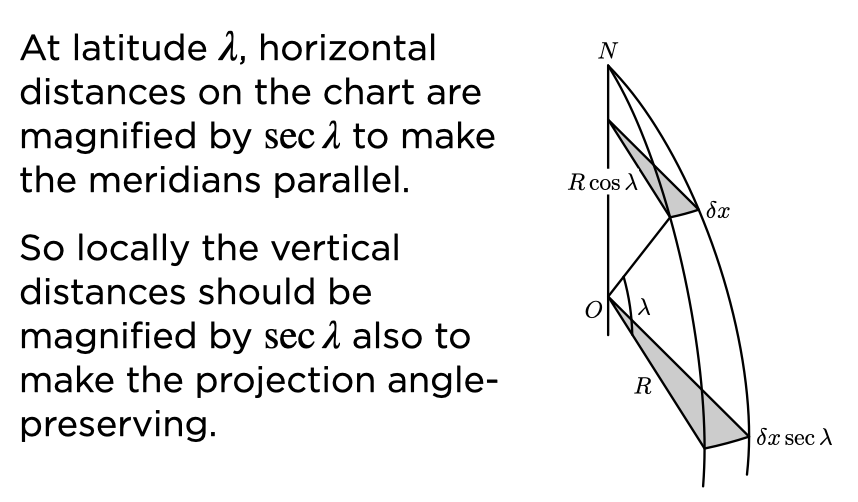
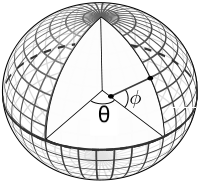
- φ = latitude (λ in the first picture above)
- θ = longitude
- δθ = δx
- R cos(λ) / R = δx / d ⇒ d = δx / cos(λ) = δx sec(λ) -------- on the Mercator chart --------
- (x,y) = M(R,θ,φ)
- x = θ, -π ≤ θ ≤ π
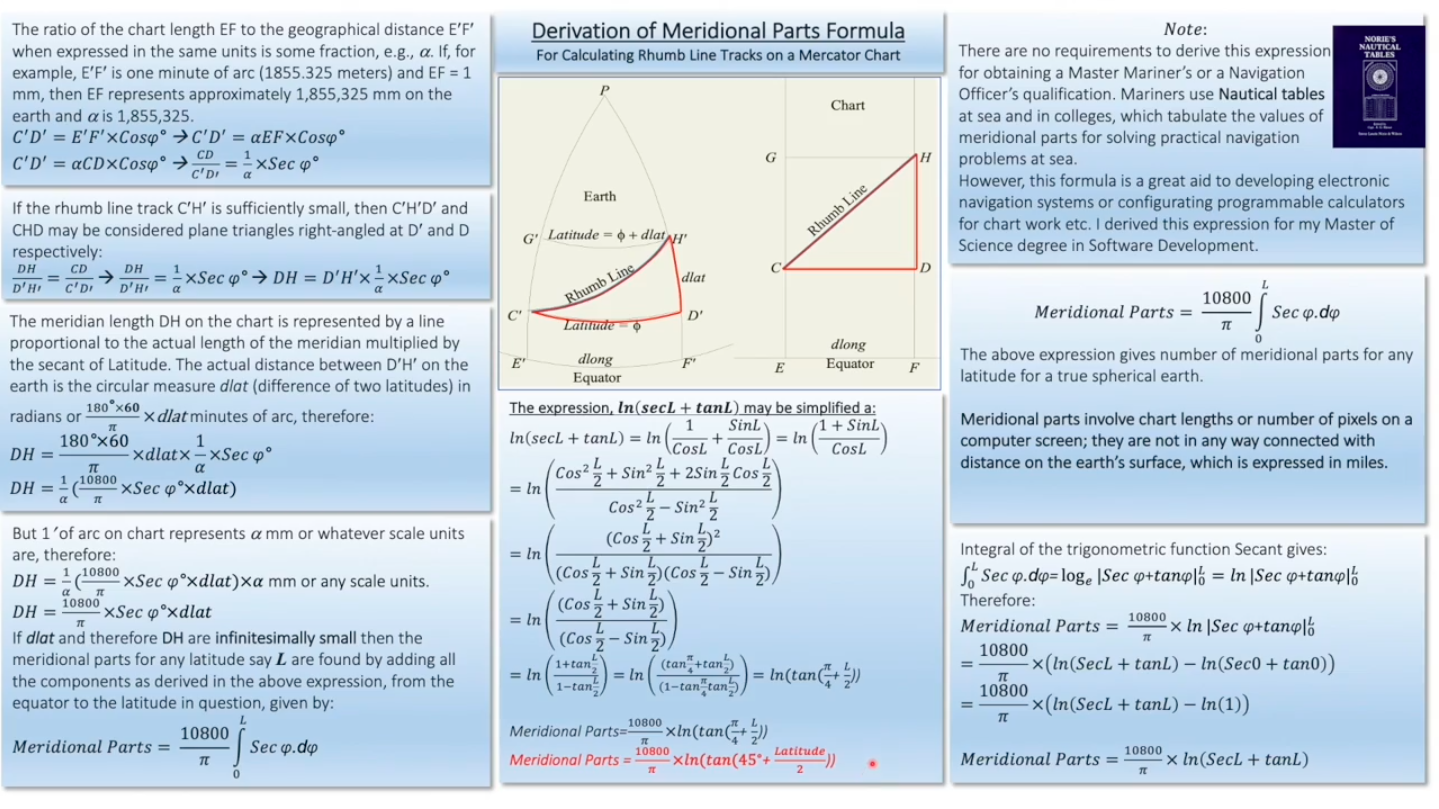
- y = ∫ φ 0sec(λ) dλ = ln [tan (π/4 + φ/2)], -π/2 ≤ φ ≤ π/2
- For a square Mercator chart, -π ≤ y ≤ π ⇒ φ ∈ [-85.051129°, 85.051129°]
- MP = 10800/π * ln [tan (π/4 + φ/2)] minutes of arc length (not using the spheroid shape of the earth)
- MP = toDegrees(toMercator(toRadian(φ))) * 60
- φ = 2 tan-1 (ey) - π/2, -π ≤ y ≤ π → -85.051129° ≤ φ ≤ 85.051129° -------- loxodromes --------
- φ = latitude
- θ = longitude
- α = bearing angle (measured clockwise in degrees from north)
- tan(90° - α) = cot(α) = 1/tan(α) = dx/dy
- dx = R cos(φ) dθ
- dy = R dφ
- tan(α) = dx/dy = cos(φ) dθ/dφ
- dθ/dφ = tan(α) sec(φ)
- ∫sec(φ) dφ = 1/tan(α) ∫dθ ⇒ tan(α) ∫sec(φ) dφ = (θ - θ0)
- (θ - θ0) = ∫ φ φ0 tan(α) sec(φ) dφ
- θ(φ) = θ0 + tan(α) ln [tan (π/4 + φ/2) / tan (π/4 + φ0/2)] = θ0 + tan(α) * diffMercator(φ, φ0)
The Web Mercator projection, on the other hand, is a variant of the Mercator projection, which is widely used in web mapping applications. It was designed to work well with the Web Mercator coordinate system, which is based on the WGS 84 datum. The projection is neither strictly ellipsoidal nor strictly spherical, and it uses spherical development of ellipsoidal coordinates. The underlying geographic coordinates are defined using the WGS 84 ellipsoidal model of the Earth's surface but are projected as if defined on a sphere. Misinterpreting Web Mercator for the standard Mercator during coordinate conversion can lead to deviations as much as 40 km on the ground. Nonetheless, all formulae implemented in this application consider the globe as a perfect sphere.
It is impressive how Gerardus Mercator was able to create such a projection in a time (1569) when there was no calculus (integrals, derivatives — Leibniz-Newton, 1674-1666) or even logarithm tables (John Napier, 1614). This is an example of the need for calculus to solve a navigation technological issue that had an enormous economic impact. The first application of calculus to solve this map's meridional spacing was by English mathematician Edward Wright in 1599. Wright's geometric proof conceptually utilized the integral of the secant function. At the time, this closed-form solution was 50 years away from being discovered. The actual calculus formulation and logarithmic proofs for Mercator's scaling only emerged in the mid-to-late 1600s, primarily through the works of James Gregory and Isaac Barrow.
Mercator texture coordinates can be set in a model directly or in the shader that samples texture coordinates for each pixel. Since a unit sphere fits in the WebGL NDC space, it is possible to go into each fragment from:- cartesian → spherical (equirectangular) → Mercator
- (x, y, z) → (long, lat) → (x, y)
- sample texture at (x, y)
Its meridian scale is 1 meaning that the distance along lines of longitude remains the same across the map, while its parallel scale varies with latitude, which means that the distance along lines of latitude is stretched by a factor of sec(φ). Ptolemy claims that Marinus of Tyre invented the projection in the first century (AD 100). The projection is neither equal area nor conformal. In particular, the plate carrée (flat square) has become a standard for global raster datasets.
As a final remark, I thought it would be easier to deal with map images as textures, but I was mistaken. I tried, as long as I could, not to rewrite third-party code. Unfortunately, this was impossible. The main issue was that the prime meridian is at the center of a map image and not at its border, which corresponds to its antimeridian.
Initially, I used the basic-object-models-IFS package, but the models had their z-axis pointing up as the zenith, and I wanted the y-axis to be the north pole (up). Therefore, I switched to Three.js, and almost everything worked just fine. Nonetheless, a sphere created by subdividing a polyhedron had its texture coordinates rotated by 180° and a cylinder or cone by 90°. In fact, there is a poorly documented parameter, thetaStart, that does fix just that.
Nevertheless, I decided to adapt the hws software to my needs by introducing a global hook, yNorth, and rotating the models accordingly. Furthermore, I added the parameter stacks to uvCone and uvCylinder, to improve interpolation and fixed the number of triangles generated in uvCone. This way, the set of models in hws and three.js became quite similar, although I kept the "zig-zag" mesh for cones and cylinders in hws (I have no idea whether it provides any practical advantage). A user can switch between hws and three.js models by pressing a single key (Alt, ❖ or ⌘) in the interface.
There is a lot of redundancy in the form of vertex duplication in all of these models that precludes mipmapping artifacts. The theoretical number of vertices, 𝑣, for a manifold model and the actual number of vertices (🔴) are displayed in the interface. The number of edges, e, is simply three times the number of triangles, t, divided by two.
For any triangulation of a compact surface, the following holds (page=52):- 2e = 3t,
- e = 3(𝑣 - χ), χ(S²)=2,
- 𝑣 ≥ 1/2 (7 + √(49 - 24χ)).
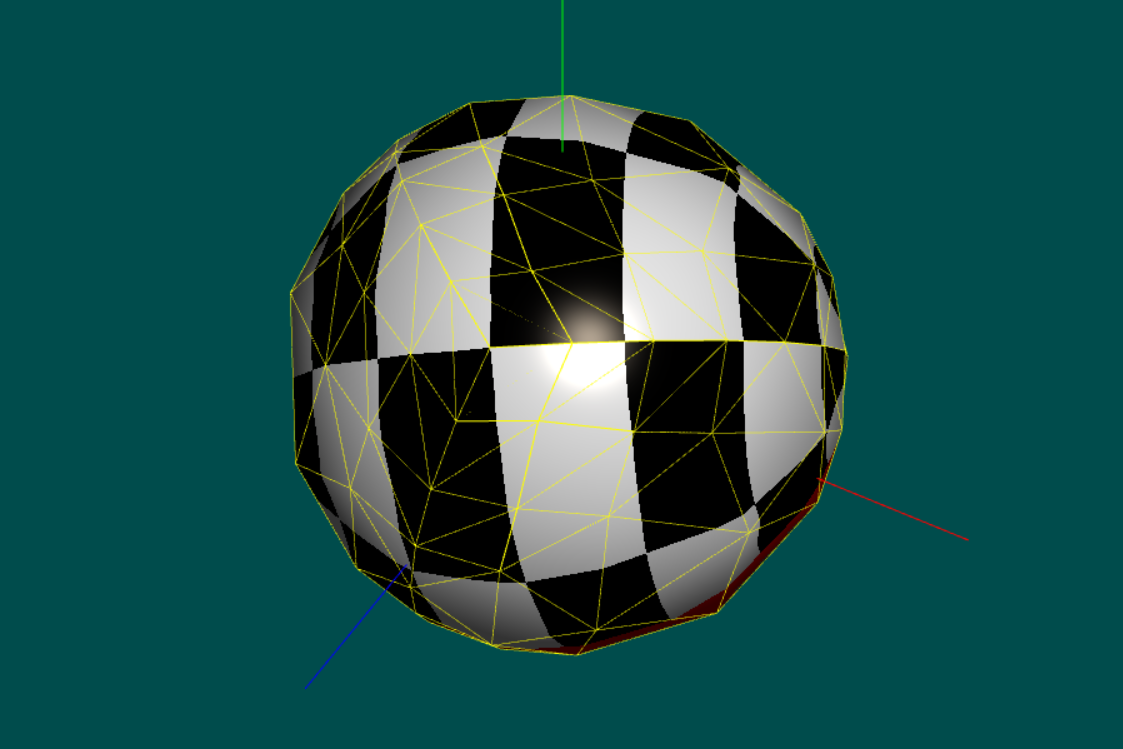
As a proof of concept, I implemented a sphere model without any vertex duplication. Besides being much harder to code, its last slice (e.g., slices = 48) goes from 6.152285613280011 (2π/48 * 47) to 0.0 and not 2π (if there was an extra duplicate vertex), which generates texture coordinates going from 0.9791666666666666 (47/48) to 0.0 and not 1.0. Although this discontinuity is what causes the mipmapping artifacts, it has nothing to do with the topology of the model but how mipmapping is implemented on the GPU. However, since an entire line is mapped onto the vextex at the north or south pole, and a vertex can have only one pair of texture coordinates (u,v), no matter what value we use for the "u" coordinate (e.g., 0 or 0.5), the interpolation will produce an awkward swirl effect at the poles.
Of course, these are just polygon meshes suitable for visualization and not valid topological B-rep models that enforce the Euler characteristic by using the winged-edge, quad-edge, or radial-edge data structures required in solid modeling.The application: Around The World in 481 historical figures.
When I was a child and forced to study history, I was never able to visualize the actual location of an event. For instance, where were the locations of Thrace, Anatolia, Troy, the Parthian Empire, the Inca Empire, and Rapa Nui?
Therefore, I have always wanted to present, in a graphical way, the connection between historical events in time and space. I think I have been able to implement a reasonable application for doing just that. However, how I implemented it is not the main point. For not using any npm packages or bundlers, I decided to stick only with HTML, CSS, JavaScript, and WebGL, plus some packages, including three.js.
The documentation is extensive because I aimed to use it in an introductory computer graphics course. However, I have come to realize that computer graphics has become a commodity, much like database management; everyone utilizes it, yet very few people are interested in understanding the underlying mechanics. This trend poses a challenge for educators, as it becomes increasingly important to inspire curiosity and a deeper appreciation for the artistic and technical aspects of graphics programming. By focusing on foundational principles, I hope to encourage students to explore beyond the surface and engage with the creative possibilities that computer graphics offers.
Of course, everything could have been implemented using three.js only, although I am not sure OrbitControls would give me the flexibility I needed to build the interface. Exploring alternative libraries and frameworks could provide additional tools and features that enhance the user experience and streamline development. Ultimately, the goal is to create an environment where students feel empowered to experiment and innovate, pushing the boundaries of what they can achieve in graphics programming.
I used no AI, and for three or four months when I woke up, I picked up an event and read a lot of material, mainly Wikipedia, for dating the events associated with a site. As a consequence, it is clear to me now that I know very little about Africa and Australia. This realization has sparked a desire in me to delve deeper into the histories and cultures of these regions. I plan to explore diverse resources, including books, documentaries, and discussions with knowledgeable individuals, to gain a more comprehensive understanding of their rich narratives.
It is possible to cycle through the historical figures by country when choosing a two letter ISO country code in the interface. For example, selecting "BR" will display all the figures from Brazil, while "US" will show those from the United States of America. The sorting of dates uses the day, month and year of the last date of the last entry in the remarkable list field. E.g., "The Blitz (Battle of Britain), 10 July 1940 - 11 May 1941" is sorted using "10 July 1940".
Dates should be preceded by a comma in the remarkable list field to be considered for sorting (no error checking is done). Examples:
 , 324                       (1 0 324)
 , 657 BC                    (1 0 -657)
 , 330-1453                  (1 0 330)
 , 10 July 1940 - May 1941   (10 6 1940)
 , 15 July 1099              (15 6 1099)
Note:
- ☠ means Caribbean,
- 🐇 means Bad Bunny,
- ⚔ (WW) means World War II,
- ✝ means Crusade,
- ☢ means Radiation,
- 🧪 means Laboratory,
- 🏆 means Nobel Prize,
- 🔬 means Science,
- ⛵ means Age of Discovery,
- ⚓ means Columbus's voyages,
- 🎶 means Music,
- 🔎 means Search,
- BC means Before Christ and
- AD means Anno Domini.
- The application displays the
location (when its name is checked in the interface)
of a city
as the intersection of its line of latitude (parallel) and line of longitude (meridian) on the model surface (preferably a map onto a sphere).
Your task is to pick a point in the texture image (using the mouse or any pointer device) and display its location
on the texture image (map) and on the 3D model.
- To do this, you need to convert the screen coordinates of the mouse pointer into texture coordinates (u, v), then into GCS coordinates (longitude, latitude) using the currentLocation, and optionally transforming them to Mercator coordinates.
- To draw the lines, use the lineTo() from HTML5 by placing an element <canvas> on top of the element <img>.
- This is simple to accomplish by nesting the <canvas> element with position absolute in a <div> element with position relative and the same size as the image element.
- The <canvas> element should have a higher z-index than the image element and ignore pointer events.
- Finally, define a pointerdown event handler to set the currentLocation as the gpsCoordinates "Unknown" and draw the lines by calling drawLinesOnImage in draw.
- A bigger challenge would be to pick the point directly onto the model's surface, but you'll have to implement a 3D pick in this case by casting a ray, unprojecting it, and finding its closest (first) intersection (relative to the viewer) with the polygonal surface of the model.
- The easiest way is shooting the ray from the mouse position and intersecting it against the surface of an implicit sphere by solving a second-degree equation.
- The other way is to intersect the ray against each face of the polygonal surface by testing if the ray intersects the plane of a face and then checking if the intersection point is inside the corresponding triangle.
- We select a position on the globe by clicking a mouse button in the WebGL canvas.
- To display the GCS coordinates of the pointer while the globe is spinning, we need to keep track of the cursor position and then shoot a ray through this position to find its intersection on the globe.
- Because a touch device does not have a cursor position, we can use the Phong highlight position on the globe as a cursor. To do this, we need to know the initial position of the highlight in world coordinates (0, 0, 1)—or in GCS coordinates (-90°, 0°)—and then transform it into screen coordinates.
- To exhibit a location name in 3D, it is necessary to transform its GCS coordinates into screen coordinates (pixels) and use the position HTML properties "top" and "left" of the WebGL <canvas> element (plus a tooltip element) to display the text.
- To determine a ship's latitude at sea without a GPS, it is necessary to have a sextant. What is necessary to get the ship's longitude? What calculation should be done (it is simpler than you might think)?
- What does the obliquity of the earth have to do with the glacial periods?
- The minimum distance between two points on a sphere is along the minor arc of a great circle or formally a geodesics. However, although this is the route airplanes follow for saving fuel, sailboats and ships usually follow a rhumb line (loxodrome). Why is that?
- Implement cylindrical coordinates, line-cylinder intersection and line-plane intersection to project maps and locations onto cylinders appropriately.
- Implement conical coordinates, line-cone intersection and line-plane intersection to project maps and locations onto cones appropriately.
- Since:
- 30/01/2016
- Copyright:
- © 2024-2026 Paulo R Cavalcanti.
- License:
- Licensed under the LGPLv3.
- Source:
- See:
-
- link - Texture coordinates sampled at each pixel in the fragment shader
- link2 - Texture coordinates sampled at each vertex in the vertex shader
- css - CSS file for the interface
- source
- textures
- Mapping the Sphere
- A Fresh Look at the Method of Archimedes
- From Archimedes to statistics: the area of the sphere
- Archimedes and the area of sphere
- On some information geometric structures concerning Mercator projections
- The Mathematics of Maps
- Map projections
- "Distortion", the incorrect and correct usage of the word
- The Mercator Projections
- The Mercator Projection from a Historic Point of View
- Thomas Harriot and the Mercator Map
- How Big is a Degree?
- The Mercator Saga (part 1)
- Loxodromic navigation
- Globe 3D
- Earth's circumference
- The True Size of ...
- The True Size of Countries
- leaflet-truesize plugin
- Navigational Sextant
- CasualNavigationAcademy
- Why Ships and Planes Use 'Knots' Instead of Miles per Hour
- American Practical Navigator


North Pole (y-axis) 

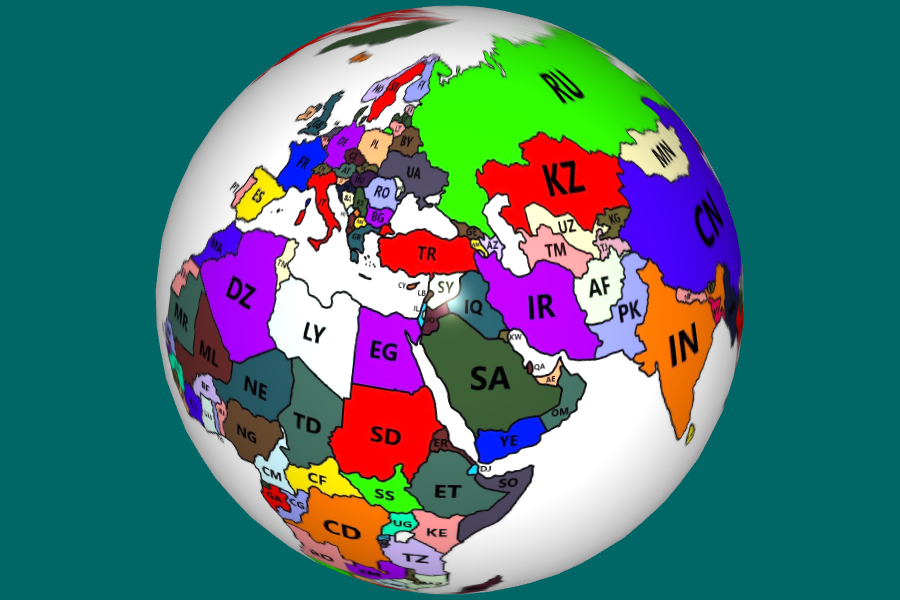
Equirectangular projection 

Mercator Projection
(not a cylindrical radial projection)
Wrong (left) x Correct (right) 
Real Country Sizes Shown on Mercator Projection 


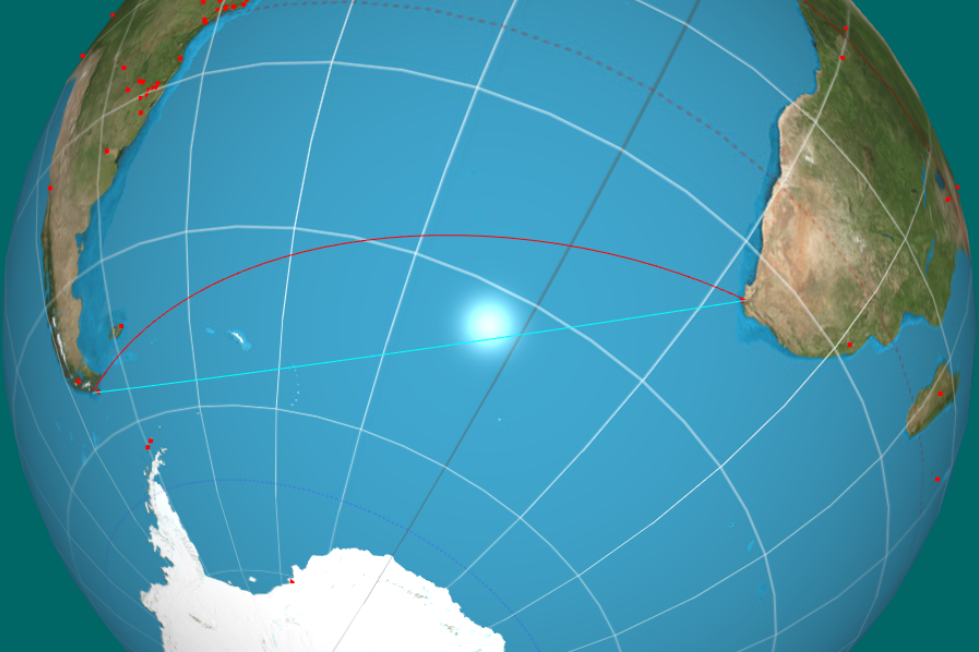
Rhumb Line (magenta) and Great Circle (cyan)
Amsterdan - Hong Kong (9281 km, 109.55°)

Spherical (Equirectangular) Projection 

Subdivision Sphere Seam - Mipmapping Artifact 

Sphere No Duplication Seam - north and south pole swirling 


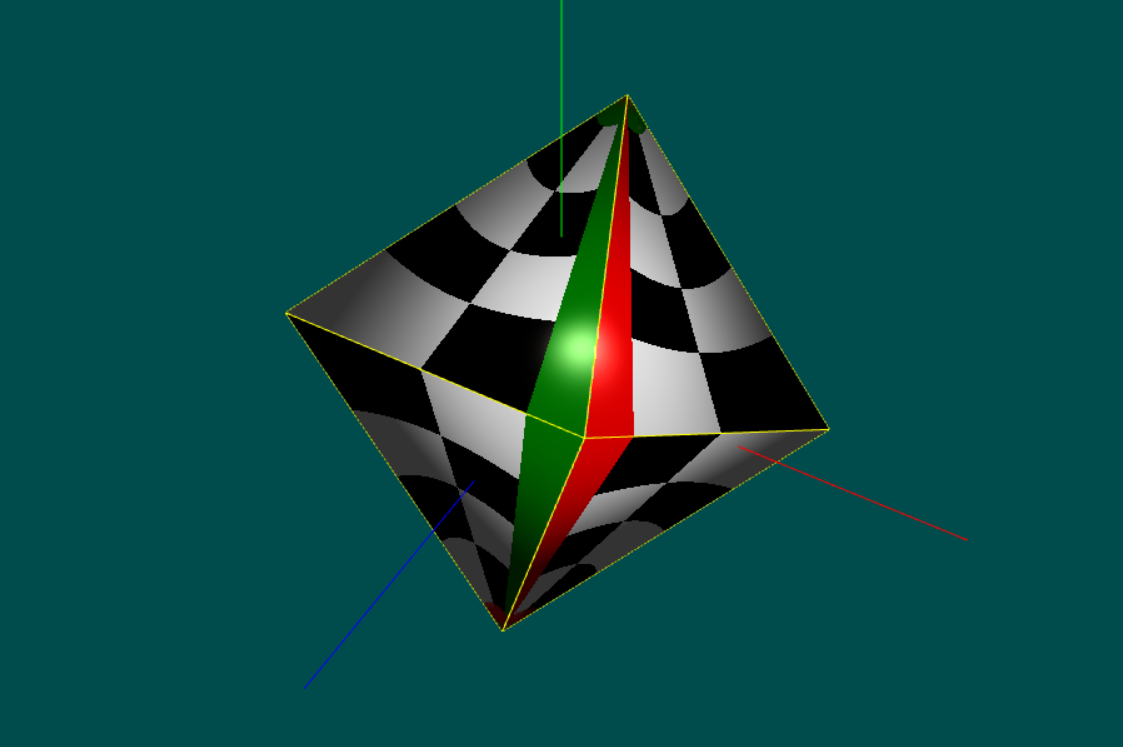
Texture Sampled in Fragment Shader
